Labels

Showing posts with label GIS 4048. Show all posts

Wednesday, August 5, 2015

GIS 4048: Final Project

Final Project:  Identify Locations with Special Circumstances for Informational Campaign

This final project involved performing location analysis of American Survey Community block groups in the City of Oxnard, Ventura County, California with special circumstances (selected criteria) to be considered in the crafting of an information campaign for a new citywide tax district.  The selected criteria included:

·         Areas far from City Hall.
·         Areas far from City maintenance yard.
·         Areas with a large population.
·         Areas with a high rate of population below the poverty line.
·         Areas with a high rate of limited English language proficiency.

The location analysis included the use of the Weighted Overlay tool resulted in two maps representing all criteria individually, all criteria weighted equally against each other, and the poverty and limited English criteria preferred over other criteria. 


Final Thoughts:

The project was interesting and applicable to the work I do as a consultant assisting public agencies to create and manage tax districts.  I am satisfied with the results.  In hindsight, I would have liked to have used more current data (instead of 2013) and if possible it could have been obtained privately at extra costs.  The next deliverable on this project would have been a close up version of the selected ACS block groups with suggested locations for public informational meetings nearby such as public schools.  This analysis could be performed with network analyst to determine the most accessible locations for the meetings within or near the selected ACS block groups.

Great class!  Learned a lot, but I am looking forward to the break between Summer and Fall semesters – I am happy to have my weekends back!


Link to my final project presentation is found below:

Tuesday, July 14, 2015

GIS 4048: Applications in GIS Module 9

Module 9:  Urban Planning: GIS for Local Government – Scenario 1 & 2

This week’s lab involved obtaining and editing a parcel, working with parcel zoning, learning about the public land survey, using advanced editing techniques, and using data driven pages to create a map book.

The map below represents 1 page from my map book created with data driven pages.


Friday, July 10, 2015

GIS 4048: Applications in GIS – Participation Assignment Number 2 - Part II

Urban Planning – GIS for Local Government

The map below depicts county assessment land values and easements in the West Ridge Place subdivision in Escambia County, Florida.   Properties with similar characteristics should have similar assessment values.

A few important characteristics that affect value include lot size, improvement (building) size, age, condition, location, proximity to waterfront, and land use.  The map below is being used to look for inconsistencies for the review of assessment land values in the West Ridge Place subdivision.

According to the official subdivision plat map, the small triangle shape parcel in the middle (090310422) will be used as a sewage lift station and is not available for development.  In addition, the subdivision includes parcels designated as retention ponds and conservation easements not available for development.  These parcels are depicted on the map below at the top left corner of the map (090310410 with a value of $10,269 and 090310420 with a value of $167) and the bottom right corner of the map (090310421 with a value of $95).

The value on the following parcels should be reviewed:

  1. Parcel 090310410 with a value of $10,269 mentioned above.  Value seems excessive as compared to parcels in the subdivision with similar characteristics.
  2. Parcel 090310421 with a a value of $95 on the top left area of the map.  This parcel fronts Lamont Road and may be available for development but the value seems low as compared to other similar parcels in the subdivision.
  3. Parcel 090310165 with a value of $33,250 on the top area of the map.  Value seems a bit high as compared to parcels in the subdivision with similar characteristics.

GIS 4048: Applications in GIS – Participation Assignment Number 2 – Part 1

Urban Planning – GIS for Local Government
  
1.     Does your property appraiser offer a web mapping site?  If so, what is the web address?  If not, what is the method in which you may obtain the data?

Yes, the County of Riverside, California Assessor’s Office (same as the appraiser) has the following portal: http://pic.asrclkrec.com/

Searching for Assessor’s Parcel Number (property identification number) 961-450-008 returns the following information:


Clicking on “View Parcel Map” returns the following map:


Otherwise data could be obtained by contacting the Assessor’s Office via phone at 951-955-6200 or via email at accrmail@asrclkrec.com


2.     Most property appraiser’s websites offer a list of recent property sales by month.  Search for the month of June for the current year and locate the highest property sold.  What was the selling prices of this property?  What was the previous selling prices of this property (if applicable)? 

The highest property sold during the month of June 2015 was a 55 acre commercial/industrial property at 14950 Meridian Pkwy, Riverside, CA (Assessor’s Parcel Number: 294-640-024) sold on June 2, 2015 for $97,682,500.  It last sold on April 3, 2014 for $76,693,500.

Below is a screen shot of the list of commercial/industrial properties sold within the County in June 2015 from the County website:


The County website did not have prior sales information available, but I was able to find online from other sources:


3.     What is the assessed land value?  Based on land record data, is the assessed land value higher or lower than the last sale price?

The assessed land value for the property above is $9,500,000 with a structure value of $26,000,000 for a full assessed value of $35,500,000 which is lower than both the most recent and previous sales price.


4.     Share additional information about this piece of land that you find interesting.  Many times, a link to the deed will be available providing more insight to the sale.

I was not able to find additional information on this particular property except for the Google Earth Map below:


GIS 4048: Applications in GIS Module 8

Module 8:  Homing in on Alachua County, Florida

This week’s lab involved making location decisions, creating a basemap layer, using the euclidean distance tool, reclassifying data tool, weighted overlays tool, and model builder.

The maps below depict suitable locations by census tract in Alachua County, Florida for a homesite meeting the following criteria:

1.     Near the North Florida Regional Medical Center (NFRMC);
2.     Near the University of Florida (UF);
3.     A high percentage of people 40-49 years old;
4.     High house values (a high percentage of homeowner-occupied homes).

The first map depicts various maps representing each criteria above individually.  The second map depicts various maps representing the criteria weighted equally vs. the criteria weighted higher for proximity to NFRMC and UF.


Tuesday, June 30, 2015

GIS 4048: Applications in GIS Module 7

Module 7:  Homeland Security – Protect

This week’s lab involved the summarizing of data in a table, performing the Generate Near Table analysis, Clipping the data frame, managing elevation data, working with LiDAR data, using the LAS Toolbar, the LAS Dataset to Raster Conversion Tool, the Hillshade Function, the Viewshed Analysis, using the 3D Analyst Extension, creating Lines of Sight, and working with ArcScene Viewer.

The maps below depict critical infrastructure, security checkpoints, surveillance locations, and lines of sight in the vicinity of the finish line for the Boston Marathon so that homeland security planners can implement protective measures such as securing the perimeter and stepping up surveillance posts at ingress and egress points. 


Sunday, June 21, 2015

GIS 4048: Applications in GIS Module 6

Module 6:  Homeland Security – Prepare MEDS

One of the goals of the Department of Homeland Security (DHS) is to maintain a comprehensive geospatial database prepared, ready, available, and accessible to communities so they can prevent, prepare, respond and recover from a catastrophic event.  The Minimum Essential Data Sets (MEDS) is a geospatial dataset for homeland security planning and operations managed by the Homeland Security Infrastructure Program (HSIP).

MEDS data themes include:
Orthoimagery
Elevation -
Hydrology
Transportation
Boundaries
Structures
Geographic Names

Data should be two years current for urban areas and five years for large areas.  The data is used by various governmental agencies to prepare, prevent, respond and recover from a catastrophic event such as a terrorism attack.

This week’s lab assignment involved the compiling and manipulation of data to prepare a MEDS for the Boston Metropolitan Statistical Area (a tier 1 urban area) in anticipation of the Boston marathon.  Tier 1 urban areas are the largest, most populated metropolitan centers in the country. 

The starting datasets were downloaded from the USGS’s National Map Viewer and clipped to the Boston area of study.  A geodatabase was created and the data frame mapping environment was set including the creation of eight group layers to match the MEDS data themes above.  Datasets were manipulated, created and placed into the applicable group layer.

Some of the tools and procedures used in this lab include joining a table by attributes, setting labels to show only at specific scales, setting group layers, selecting by location to export data, working with various types of symbology and styles (like transportation specific style of symbology), setting layers to display at certain scales, extracting by mask from a raster, using colormaps, adding XY coordinate data as a layer, and saving to layer files to preserve symbology for future re-use.


Sunday, June 14, 2015

GIS 4048: Applications in GIS Module 5

Module 5:  Homeland Security – DC Crime Mapping

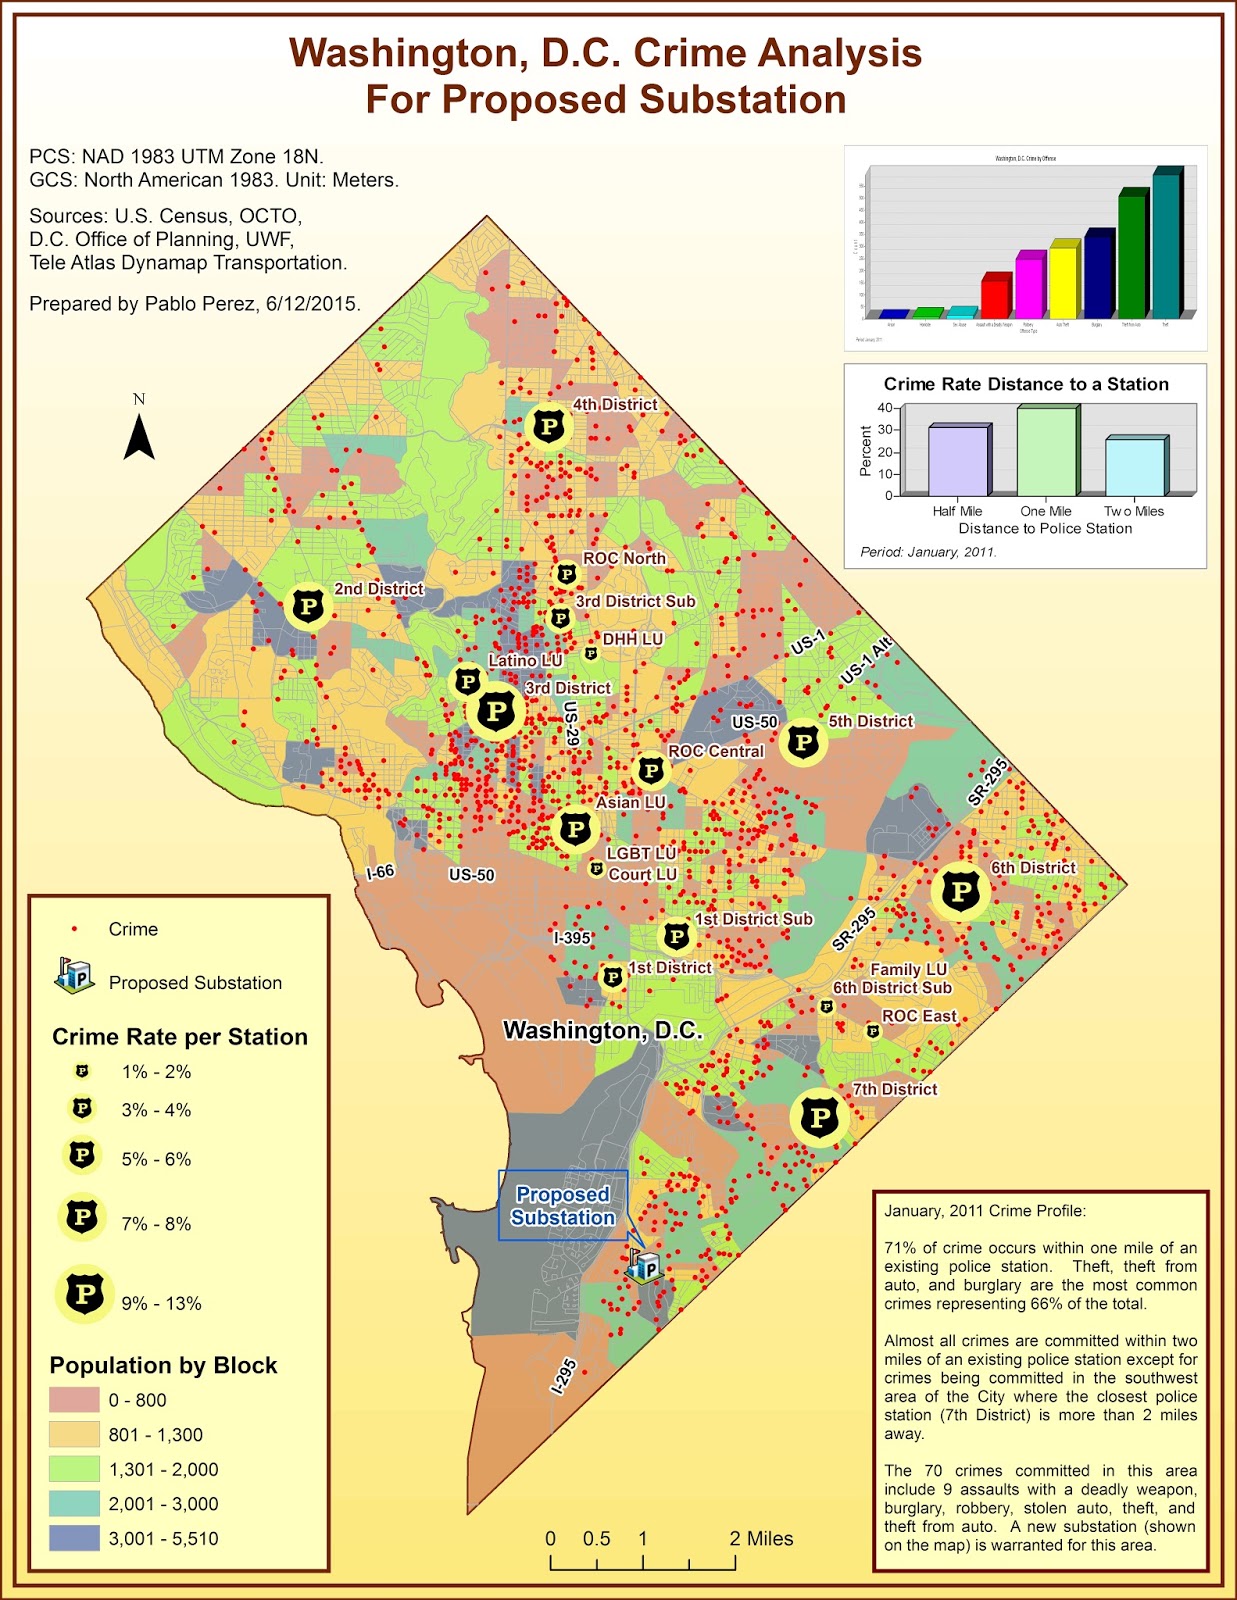
This week’s lab involved the creation of two maps based on January, 2011 crime data for Washington, DC.  The lab covered the geocoding of addresses by creating a custom address locator, creation of graphs and reports, various types of symbology, the use of the multiple ring buffer tool, spatial joins, and the spatial analyst toolbox and kernel density.

The first map represents crime rate per police station and within half-mile, one mile and two miles of a police station to determine the need for a police substation near the 7th District station where crimes are occurring but the closest station (7th District) is over two miles away.  The Multiple Ring Buffer tool was used to create the buffers.  The graphs were generated in ArcMap.  Spatial Joins were performed to determine the crime rate per buffer and per police station.

The second map represents three types of selected crimes (burglary, homicides, and sex abuse) in relation to population density.  Population density is based on U.S. Census data by census block for 2004.  Crime density was calculated by using the Kernel Density Tool with a 1,500 sq. km. search radius.  The population density was symbolized as graduated symbols in contrast to graduated colors used for crime density making the map easier to read.  The analysis indicates that population density generally has a relation to crime density, but that is not always the case as with homicides and sex abuse.


Below are the two maps depicting crime analysis for Washington, D.C.


Saturday, June 6, 2015

GIS 4048: Applications in GIS Module 4

Module 4:  Hurricanes

This week’s lab involved the creation of two maps related to Storm Sandy that hit the New Jersey shore in October 2012.  The lab covered the use of Excel data, creation of custom symbology, advanced labeling, map grids, the effects toolbar, setting geodatabase attribute domains, and editing features using domain properties.

The first map depicts the status and path of Storm Sandy as it hit the New Jersey shoreline.  The path was created by using the Points to Line Tool in ArcToolBox thus creating a polyline feature class from a points feature class containing data for Storm Sandy.  The hurricane specific symbology was created with Character Marker Symbols and saved to my user profile for future use.  The meridians and parallels were added to the map by setting a new grid under the data frame properties.  Maximizing map space became a little challenging as the longitude and latitude markers take print area space.  I was able to re-align the latitude readings vertically to save space.

The second map depicts structural damage to one side of street in the Tom’s River Township based on pre and post storm imagery.  The Slider Tool of the Effects Toolbar was used to swipe (peel on/off) the imagery to determine structural damage based on the before and after imagery.  A new point feature class was created along with Attribute Domains to limit possible values for the various damage assessment fields thus reducing data entry errors. 

Below are the two maps depicting Storm Sandy’s path and damage assessment.


Sunday, May 31, 2015

GIS 4048: Applications in GIS Module 3

Module 3:  Data Management Skills and Tsunami Evacuation: Creating Evacuation Zones

This week’s lab had two parts: data management skills and the creation of evacuation zones for a tsunami.  The data management skills portion involved the creation of a file geodatabase, the creation of a feature dataset, addition of feature classes, tables with spatial coordinates, and raster datasets.

I found the tools used in relation to the raster datasets particularly interesting.  The Build Raster Attribute Table was used to get elevation value and count fields to be used for subsequent elevation analysis.  The Mosaic to New Raster was used to join multiple raster datasets together so that we did not have to run the same calculation multiple times because of separate and multiple raster datasets.  And the Calculate Statistics tool was used on the raster datasets so that the data could be later classified.

The second part of the lab involved the creation of radiation and inundation zones around the Fukushima II nuclear power plant in Japan.  Again the Multiple Buffer Tool was used to create buffer/evacuation zones which were later clipped to an administrative feature class on land to get rid of buffer zones in the ocean. 

I use the Building a Label Expression to join the City names and corresponding population in the labels – I found this very helpful.  A VBScript command was used in a SQL expression as follows: [City] &vbnewline & [Pop].  Model builder was used to create a model that used the Con, Raster to Polygon, Append, Create Feature Class, and Intersect Tools to process an elevation dataset of the area (DEM) to create three different inundation zones (at different elevation ranges) while also identifying cities, nuclear plants, and roads that intersected those inundation zones.  Overall, this was one of my favorite labs so far…though a very long one.

Below is the map representing Radiation and Inundation Zones for the Fukushima II Nuclear Power Plant in Japan.

Monday, May 25, 2015

GIS 4048: Applications in GIS Module 2

Module 2: Natural Hazards: Lahars

This week’s assignment involved the analysis of spatial data in GIS to identify potential inundation zones from Lahars for the Mount Hood Volcano in Oregon.  Lahar is also called volcanic mudflow or debris flow.  Lahar is a mixture of water and volcanic debris that moves rapidly downstream.  Consistency can range from that of muddy dishwater to that of wet cement, depending on the ratio of water to debris.  Lahars pose the greatest hazard because more people live downstream in lahar-prone river valleys than live on the volcano’s flanks. 
              
The assignment involved the creation of data using the Go to XY tool including the convert graphics feature, the use of the Spatial Analyst Extension, the “joining” of multiple raster datasets into a single raster using the Mosaic to Raster tool, the use of the Hydrology toolset to perform flow and directional analysis, the use of census data and analyzes performed based on distance to ultimately assess hazard areas.

In my experience, the most difficult part of this assignment was selecting proper labels and symbology to represent readable data amongst the clutter of feature classes and colors in a limited space.

Below is the hazard assessment map for the pre-determined area of study around Mount Hood, Oregon.