Module 5: Homeland Security – DC Crime Mapping
This
week’s lab involved the creation of two maps based on January, 2011 crime data
for Washington, DC. The lab covered the
geocoding of addresses by creating a custom address locator, creation of graphs
and reports, various types of symbology, the use of the multiple ring buffer
tool, spatial joins, and the spatial analyst toolbox and kernel density.
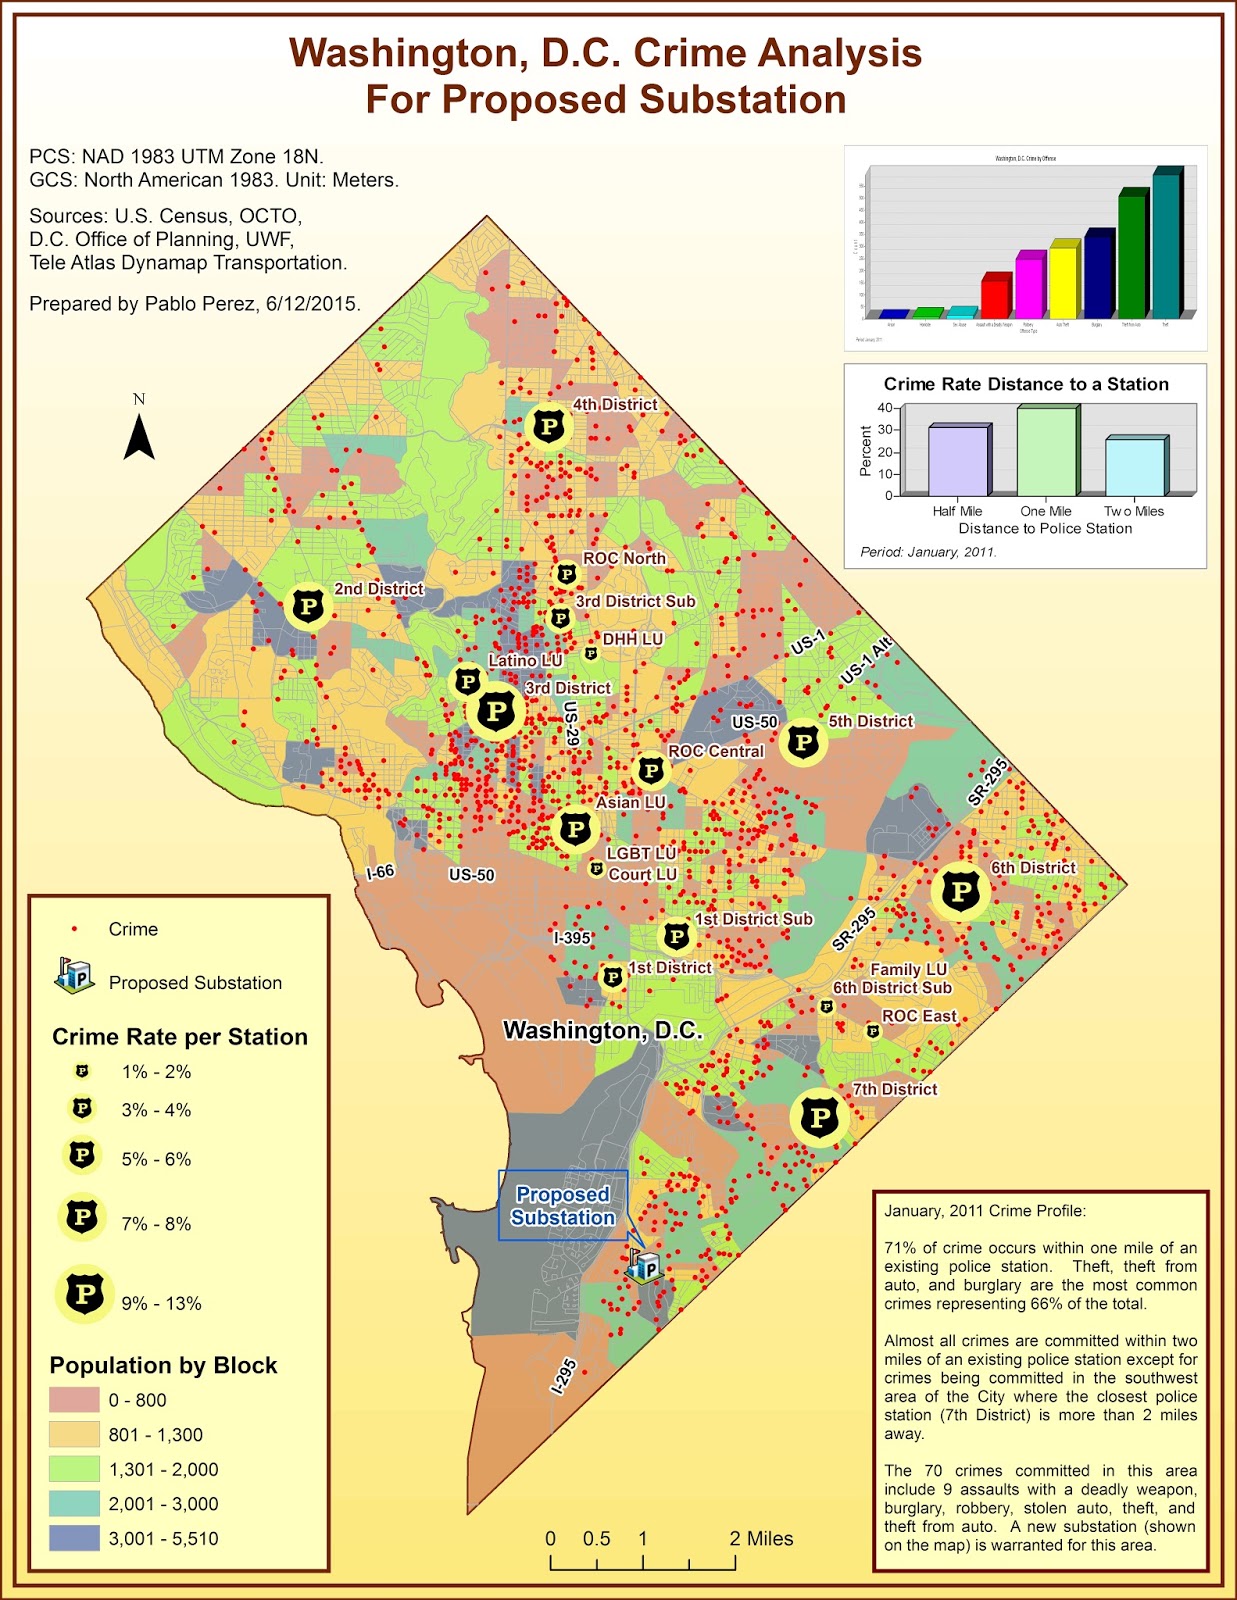
The
first map represents crime rate per police station and within half-mile, one
mile and two miles of a police station to determine the need for a police
substation near the 7th District station where crimes are occurring but
the closest station (7th District) is over two miles away. The Multiple Ring Buffer tool was used to
create the buffers. The graphs were
generated in ArcMap. Spatial Joins were
performed to determine the crime rate per buffer and per police station.
The
second map represents three types of selected crimes (burglary, homicides, and
sex abuse) in relation to population density.
Population density is based on U.S. Census data by census block for
2004. Crime density was calculated by
using the Kernel Density Tool with a 1,500 sq. km. search radius. The population density was symbolized as
graduated symbols in contrast to graduated colors used for crime density making
the map easier to read. The analysis
indicates that population density generally has a relation to crime density,
but that is not always the case as with homicides and sex abuse.
Below
are the two maps depicting crime analysis for Washington, D.C.

No comments:
Post a Comment