Labels

Tuesday, July 28, 2015

GIS 4102: GIS Programming Module 10

Module 10: Creating Custom Tools

This week’s lecture covered creating custom tools, editing tool code, setting tool parameters, working with tool messages, and customizing the tool progress information.

This week’s assignment involved creating a script tool from a Python script that clips multiple layers at once.  The assignment included:

·         Creating a new custom Toolbox.
·         Adding a Script Tool from the Python script.
·         Setting the parameters of the newly created Tool.
·         Modifying the script to reflect the new Tool parameters.
·         Sharing the Toolbox, Tool and Script.

Below are screenshots of the Tool’s dialog window in ArcMap and successful results window in ArcMap after running the Tool.


Saturday, July 18, 2015

GIS 4102: GIS Programming Module 9

Module 9: Working with Rasters

This week’s lecture covered the use of the List and Describe functions with rasters, using raster objects in geoprocessing, using map algebra in operators, and working with classes to define raster tool parameters. 

This week’s assignment involved writing a script that creates a raster output that identifies areas with a particular set of parameters (slope, aspect, land cover type).  The final raster output highlights areas with the following traits:

·         Forest landcover with classifications 41, 42, and 43.
·         Slope between 5 – 20 degrees.
·         Aspect between 150 – 270 degrees.


Below is a screen shot of the final raster.


Tuesday, July 14, 2015

GIS 4048: Applications in GIS Module 9

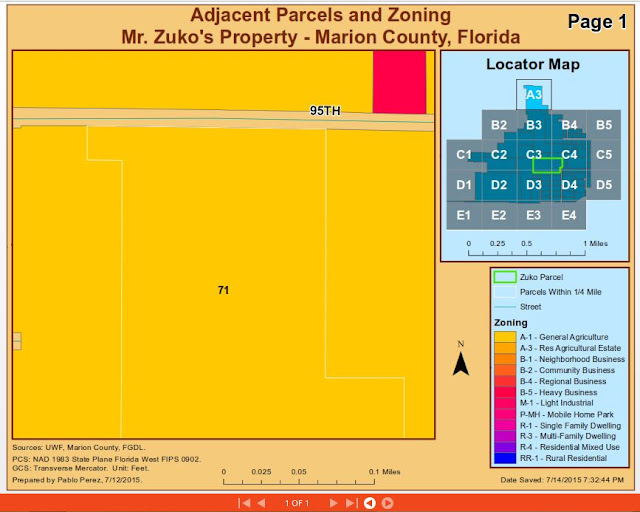
Module 9:  Urban Planning: GIS for Local Government – Scenario 1 & 2

This week’s lab involved obtaining and editing a parcel, working with parcel zoning, learning about the public land survey, using advanced editing techniques, and using data driven pages to create a map book.

The map below represents 1 page from my map book created with data driven pages.


Sunday, July 12, 2015

GIS 4102: GIS Programming Module 8

Module 8: Working with Geometries

This week’s lecture covered working with geometry objects, reading and writing geometries, and working with multipart features.

This week’s assignment involved writing a script that creates a .txt file and writes to it the coordinates and Object IDs for vertices in a shapefile by using geometry objects, using a search cursor, and nested loops.


Below is a screen shot of the records written to the .txt file by the script.


Friday, July 10, 2015

GIS 4048: Applications in GIS – Participation Assignment Number 2 - Part II

Urban Planning – GIS for Local Government

The map below depicts county assessment land values and easements in the West Ridge Place subdivision in Escambia County, Florida.   Properties with similar characteristics should have similar assessment values.

A few important characteristics that affect value include lot size, improvement (building) size, age, condition, location, proximity to waterfront, and land use.  The map below is being used to look for inconsistencies for the review of assessment land values in the West Ridge Place subdivision.

According to the official subdivision plat map, the small triangle shape parcel in the middle (090310422) will be used as a sewage lift station and is not available for development.  In addition, the subdivision includes parcels designated as retention ponds and conservation easements not available for development.  These parcels are depicted on the map below at the top left corner of the map (090310410 with a value of $10,269 and 090310420 with a value of $167) and the bottom right corner of the map (090310421 with a value of $95).

The value on the following parcels should be reviewed:

  1. Parcel 090310410 with a value of $10,269 mentioned above.  Value seems excessive as compared to parcels in the subdivision with similar characteristics.
  2. Parcel 090310421 with a a value of $95 on the top left area of the map.  This parcel fronts Lamont Road and may be available for development but the value seems low as compared to other similar parcels in the subdivision.
  3. Parcel 090310165 with a value of $33,250 on the top area of the map.  Value seems a bit high as compared to parcels in the subdivision with similar characteristics.

GIS 4048: Applications in GIS – Participation Assignment Number 2 – Part 1

Urban Planning – GIS for Local Government
  
1.     Does your property appraiser offer a web mapping site?  If so, what is the web address?  If not, what is the method in which you may obtain the data?

Yes, the County of Riverside, California Assessor’s Office (same as the appraiser) has the following portal: http://pic.asrclkrec.com/

Searching for Assessor’s Parcel Number (property identification number) 961-450-008 returns the following information:


Clicking on “View Parcel Map” returns the following map:


Otherwise data could be obtained by contacting the Assessor’s Office via phone at 951-955-6200 or via email at accrmail@asrclkrec.com


2.     Most property appraiser’s websites offer a list of recent property sales by month.  Search for the month of June for the current year and locate the highest property sold.  What was the selling prices of this property?  What was the previous selling prices of this property (if applicable)? 

The highest property sold during the month of June 2015 was a 55 acre commercial/industrial property at 14950 Meridian Pkwy, Riverside, CA (Assessor’s Parcel Number: 294-640-024) sold on June 2, 2015 for $97,682,500.  It last sold on April 3, 2014 for $76,693,500.

Below is a screen shot of the list of commercial/industrial properties sold within the County in June 2015 from the County website:


The County website did not have prior sales information available, but I was able to find online from other sources:


3.     What is the assessed land value?  Based on land record data, is the assessed land value higher or lower than the last sale price?

The assessed land value for the property above is $9,500,000 with a structure value of $26,000,000 for a full assessed value of $35,500,000 which is lower than both the most recent and previous sales price.


4.     Share additional information about this piece of land that you find interesting.  Many times, a link to the deed will be available providing more insight to the sale.

I was not able to find additional information on this particular property except for the Google Earth Map below:


GIS 4048: Applications in GIS Module 8

Module 8:  Homing in on Alachua County, Florida

This week’s lab involved making location decisions, creating a basemap layer, using the euclidean distance tool, reclassifying data tool, weighted overlays tool, and model builder.

The maps below depict suitable locations by census tract in Alachua County, Florida for a homesite meeting the following criteria:

1.     Near the North Florida Regional Medical Center (NFRMC);
2.     Near the University of Florida (UF);
3.     A high percentage of people 40-49 years old;
4.     High house values (a high percentage of homeowner-occupied homes).

The first map depicts various maps representing each criteria above individually.  The second map depicts various maps representing the criteria weighted equally vs. the criteria weighted higher for proximity to NFRMC and UF.


Monday, July 6, 2015

GIS 4102: GIS Programming Module 7

Module 7: Explore/Manipulate Spatial Data

This week’s lecture covered checking for, describing, and listing data, working with lists and dictionaries, working with search cursors, update cursors, insert cursors, running SQL queries, and validating table and field names.

This week’s assignment involved writing a script to do the following:

1.     Create a new geodatabase.
2.     Copy all data from a data folder into the new geodatabase.
3.     Populate a dictionary with the names and population of every county seat city in New Mexico.
4.     Printing messages before and after each process.

Below is a screen shot of the results in the Interactive Python window.